While uncertainty clouds the economic outlook and heckles the markets ahead of the announcement of US reciprocal tariffs, the skies seem to be clearing for Cagliari Calcio… thanks to its victory over Monza yesterday. With a 6-point lead over first-to-be-relegated, Empoli, a win against the latter next week-end would virtually guarantee their survival in Serie A with only 7 matchdays remaining thereafter. In my views, the so called “Liberation Day” seems indeed closer for my favorite soccer team than ever (fingers crossed), while I highly doubt than the uncertainty regarding tariff wars will be swiftly removed out of global economic policy. Let alone be considered as a positive development.
To bring a drop of clarity in an ocean of uncertainty, the reciprocal tariffs announcement must give unambiguous answers to these 3 questions: (1) which countries or sectors will be hit? (2) by how much? (3) when will they be implemented? Let’s take one question at a time.
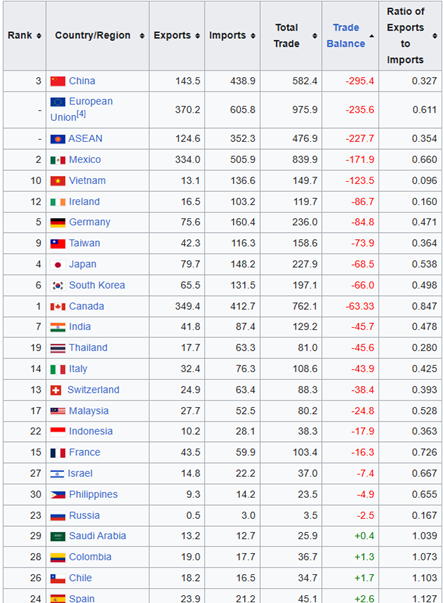
To start with, instead of declaring “universal” (read global and across the board) tariffs, it would be wiser and clearer (for businesses as well as for investors) to only target the main trading partners or specific sectors, which represent the bulk of the trade deficit. Focusing only in exports and imports of goods, the top 30 trading partners represent circa 90% of US imports (and about 85% of US exports). Last year, the US goods trade deficit reached $1’200bn and, as you can see on the table here below, less than 20 countries run a trade surplus with the US. Interesting to note that Vietnam alone is responsible for 10% of the US trade deficit ($123bn) or that the trade deficit with Ireland is slightly higher than the one with Germany… In the first case, this is explained by the shift in production from China to Vietnam during the first wave of tariffs in 2016-2020, while in the second it is certainly linked to the establishment of major American companies in Ireland. Then, including the services sector, the US trade deficit shrink to 900bn… meaning that the US is actually a net exporter of services! So, even if it seems easy, on the paper, to get a list of 15-20 economies you deem responsible for the deindustrialization of the US, it isn’t really so straightforward to track, identify, target and thus correct these imbalances. With the risks of shooting itself in the foot and incurring some retaliation (on services).
Among the largest US trading partners in goods as of 2024 (these figures do not include services or FDI) ranked from the largest trade deficit to the smallest

It becomes trickier when we consider the amount/percentage of these (additional) reciprocal tariffs. There are basically 3 layers: unfair trading practices, currency manipulation or excessive undervaluation and VAT differentials. As you suspect, they all vary meaningfully depending on countries or sectors… Assuming an average (weighted by US imports) 10-15% for both currency undervaluation and VAT differentials, and adding an arbitrary 0%-5% for unfair trading practices (there are some academic studies trying to figure out their “costs”), you already get easily above 20%. So, my basic take-away is that Trump will likely start with double digits reciprocal (additional) tariffs and then eventually negotiate them down if the countries comply to specific rules/constraints. Potentially even on other matters than those related directly to trading activity with the US.
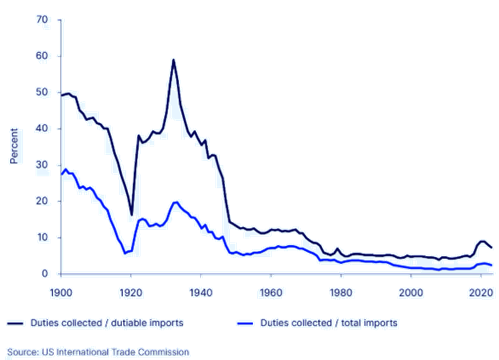
According to the most prominent economists and forecasters, they could add roughly 5% (best case) to 15% (worst case) to the overall US tariff rate. As the trade tariffs actions taken to date (assuming they remain in place through year-end) already imply an overall US tariff rate above 10% (highest since WWII, see the light blue line in the graph below), the aggregate US tariff rate could reach in between 15% and 25% at the end.
US custom duties (% imports) since 1929

Finally, about the timing, it could be a few days after the announcement to a few weeks or months, which seems a more likely scenario in case of not-so-benign reciprocal tariffs with possible negotiations on the table. As far as auto tariffs are concerned, they will certainly be implemented as planned, i.e. as soon as this Thursday, because they are similar to the ones applied on steel and aluminum / different from those imposed to Canada and Mexico. A 25% increase it’s quite a serious and severe issue for an industry already in the middle of an existential crisis, especially in Europe. Considering that there is no clear consensus of what to expect and tariffs/economic uncertainty will remain high irrespective of what will be announced (US administration will continue using tariffs as a negotiating tool), we don’t think there won’t be much to celebrate after the “liberation day”. For sure, markets may still experience a dead cat bounce or a short squeeze the “day after”, but the long(er) term prospects for both US growth and inflation will be negatively impacted by these reciprocal tariffs. The hit to 2025 real US GDP growth could be as little as -0.3% to as high as -1.2%, while reciprocal tariffs could add anywhere from a couple of basis points to potentially +1.2% according to Deutsche Bank. Less growth and more inflation down on the road is hardly a mixture that will delight investors. The economist Joseph E. Gagnon of the Peterson Institute for International Economics recently summarized the matter well: “Although tariffs do not reduce trade deficits, they do reduce imports and exports, as well as total income.”

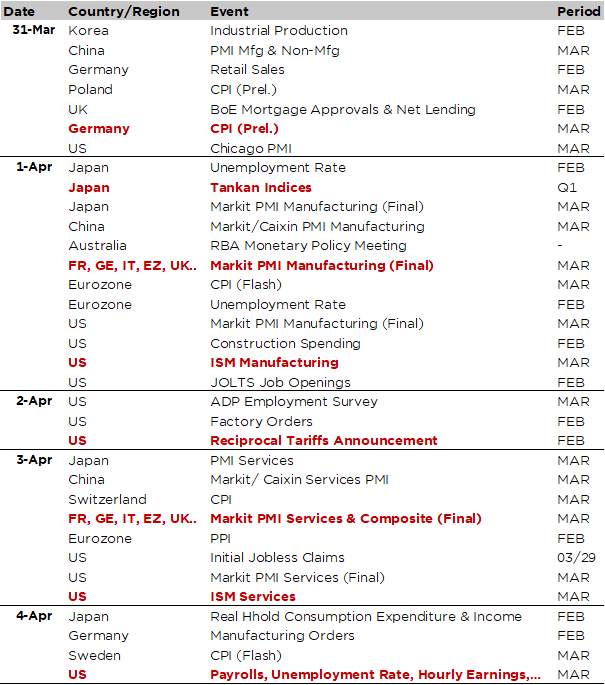
Economic calendar
No time to take a breather! After a first quarter that didn’t provide many answers and, on the contrary, raised yet more eyebrows and concerns, the second quarter is off to a flying start. In addition to the usual statistics at the start of each month (PMI indices, US ISM manufacturing and services, US job report), the fateful “liberation day” – or not, or not right away, or not really, … – of the announcement of US reciprocal tariffs is set for Tuesday April 2nd. On Thursday, 25% tariffs on imported cars will take effect too. So, fasten your seat belt for another uncertain and thus bumpy ride.
On top of the most anticipated event of the week (i.e. the US reciprocal tariffs details announcement), the key economic data release will be the March US jobs report on Friday. The Bloomberg consensus expects a monthly increase in payrolls of +135k (vs. +151k the prior month), a stable unemployment rate at 4.1% and hourly earnings growth rate staying at +0.3% MoM. Before that, we will get more color on the US labor market through the employment subcomponent of ISM indices, as well as the JOLTS and ADP reports, which will be released on Tuesday and Wednesday, respectively.
Investors will also scrutinize the US ISM indices due tomorrow (manufacturing) and Thursday (services), including their price components. The consensus expects a slight decline in both headlines with the manufacturing gauge falling back marginally below the 50 threshold (50.3 in February), while the services index is foreseen declining to 53.1 from 53.5.
This morning, the China PMI indices came slightly higher than expected with manufacturing and services gauges accelerating to 50.5 and 50.8 respectively from 50.2 and 50.4. Japan experienced mixed economic data releases as on one hand industrial production surged +2.5% in February after a -1.1% decline the prior month, while, on the other hand, retail sales YoY growth slowed from +4.4% in January to +1.4% in February (vs. +2.5% expected).
Other notable data releases this week include the German and Euro Area flash CPI for March, the RBA decision on Tuesday (no change expected with target rates staying at 4.1%), the TANKAN quarterly indices tomorrow, which will provide a good and exhaustive view of economic dynamics in Japan with a breakdown in production, employment, prices, investments dynamics by sector/company size, the unemployment rate in Europe and annual inflation rate in Switzerland for March (Thursday).

This is a marketing communication issued by DECALIA SA. It is neither directed to, nor intended for distribution or use by, any person or entity who is a citizen or resident of or located in any locality, state, country or jurisdiction where such distribution, publication, availability or use would be contrary to law or regulation. The information and data presented in this document are not to be considered as an offer or invitation to buy or sell any securities or financial instruments nor to subscribe to any services. The information, opinions, estimates, calculations etc. contained in this document reflect a judgment at the original date of publication and are subject to change without notice. Investments in any securities or financial instruments may not be suitable for all recipients and may not be available in all countries. This document has been prepared without taking account of the objectives, financial situation or needs of any particular investor. Before entering into any transaction, investors should consider the suitability of the transaction to individual circumstances and objectives. Any investment or trading or other decision should only be made by the client after a thorough reading of the relevant product term sheet, subscription agreement, information memorandum, prospectus or other offering document relating to the issue of the securities or other financial instruments. Where a document makes reference to a specific research report, the document should not be read in isolation without consulting the full research report, which may be provided upon request.
Unless specifically mentioned, charts are created by DECALIA SA based on FactSet, Bloomberg or Refinitiv data.
