In the run-up of the US presidential elections, which is now just two weeks away, the latest US economic data releases continue to please equity investors, while Cagliari Calcio maintains its positive momentum with its first home win of the season (3-2 vs. Torino). Like for the US elections, the race for staying in Serie A will be tight until the end, but it seems that there is now a favorable turnaround for both Cagliari Calcio and Donald Trump.
In the meantime, reassuring US economic data, a slightly higher than expected US CPI, and especially rising odds of a Trump victory and a Republicans sweep have also led to a strengthening dollar, tighter credit spreads, strong performance of US banks lately (also helped by their good Q3 earnings results), and higher yields on US Treasuries. In other words, the Trump trade has already filtered into financial markets. Cherry on the cake, and courtesy of GS, for seasonality’s believers: the median S&P500 return from mid-October end of the year in election years has been +7% since 1928.
Median S&P500 return from mid-October end of the year in election years
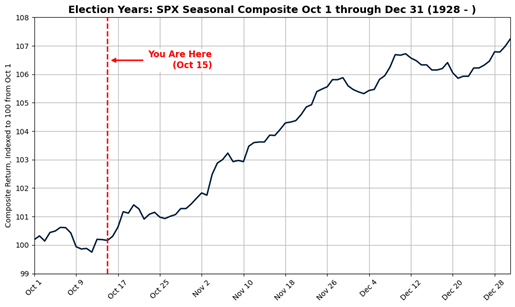
Source: Goldman Sachs
The story is somewhat different and obviously less rosy in Europe as economic growth remains moribund, especially in the Euro Area with Germany struggling, but with also clearer and faster disinflation progress, on top of less political uncertainties than in the US, which should therefore facilitate the task of central banks on our continent in their rates normalization process over the next few months. In this context, it’s worth noting that in the case of a Trump’s victory, the macro outlook for next year may become quite confusing as there could be some significant impact on growth and inflation 2025 trajectories, both in the US and outside, depending on the trade’s tariffs he will impose (how much? to which countries, sectors?).
Amid all these uncertainties ahead of us (US politics, macro outlook, policy rates trajectories and terminal point, geopolitics) and some differences or divergences across major economies, if there is one common certainty, it is that the public deficits and government debt will likely continue to balloon in the foreseeable future. According to Deutsche Bank analysts, whatever political configuration we have in the White House, the US deficit will be between around 7 to 9% from 2026-2028… Not to mention some additional structural debt burden risks down on the road associated with ageing population, decarbonization (or just dealing with increasing natural disasters) and more defense spending. So, all this explains why gold continues its march higher, in my views, hitting (again) fresh record high above $2’700 last week, while I also continue to doubt about the intrinsic safe haven characteristics of sovereign bonds in this context.
To illustrate my last point, I just considered and looked at the historical performances of two possible “defensive” investments: US Treasuries on one hand, and a mix of Gold and Cash on the other hand (I added cash in order to dampen gold’s volatility, which is much higher than bonds and also to introduce a carry component). Here are the results since the mid-90s.
50% Gold + 50% Cash total return vs. 7-10y US Treasuries total return
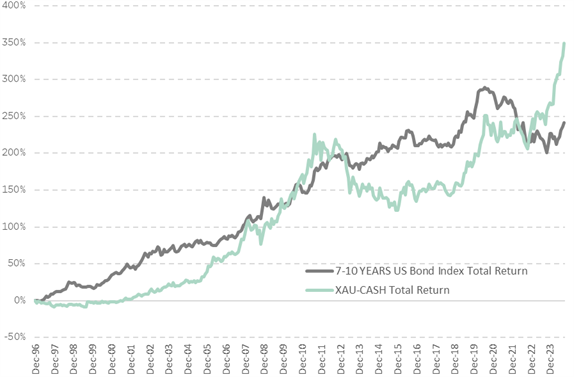
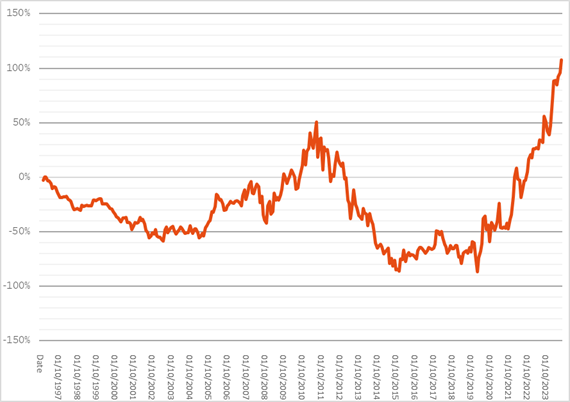
It all becomes clearer and more interesting when you look at the relative performance of this basket of Gold + Cash vs. US long Treasuries (see graph here below). There are four distinct phases:
- From the mid-90’s to 2003, with Treasuries outperforming Gold + Cash. It’s was disinflation time with absolutely no issues or very little concerns about public deficits and debt in DM (at that time the Italy BTP spread vs. Germany was about 10bps for those who can remember…)
- From 2003 to 2011, with Gold + Cash outperforming Treasuries. In my view, it was due to the China emergence on the global economy radar leading to a commodity boom and a spike in energy prices, coupled with a too accommodative Fed’s monetary policy over this period, not only for the US but also the global economy taking into account China’s booming economy a that time.
- From 2011 to 2020, with Treasuries outperforming again Gold + Cash as the GFC led to outright deflation risks, especially as budget austerity became somewhat the norm (first in Europe, then also in China to some extent) while monetary policies were not so accommodative -for the economy- despite zero or negative rates and QE. Interesting to note that US Treasuries outperformance was less clear from 2015-16… corresponding to the time when the Fed started to rise rates/envisaged to end QE before a last spike in March 2020 (when rates were slashed to 0% again)
- From 2020 to nowadays, with Gold + Cash outperforming, with a vengeance, US Treasuries, due to (1) the inflation episode following the extraordinary expansionary economic policies both in terms of coordination and magnitude following the covid-lockdowns, (2) the overall comeback of geopolitical uncertainties with the war in Russia as the main trigger and (3) rising concerns about global sovereign debt sustainability
Relative Performance of Gold-Cash mix vs. 7-10y UST
So, what could go wrong? Many things obviously could be the short answers (and not just by looking at the gold prices ascent). Perhaps a “blue wave”, if not a red one, may end this blue-sky scenario for risk-on assets. If not, then a missile or a scud in the case of a geopolitical accident (Russia-Ukraine? North Korea?) or an escalation in the Middle-East, could be the next trouble-maker. A “Liz Truss moment” for the US or France? The only certainty we may have it that the current favorable backdrop for risks won’t last forever, so just carpe diem! and try to find efficient hedging to cover your back.
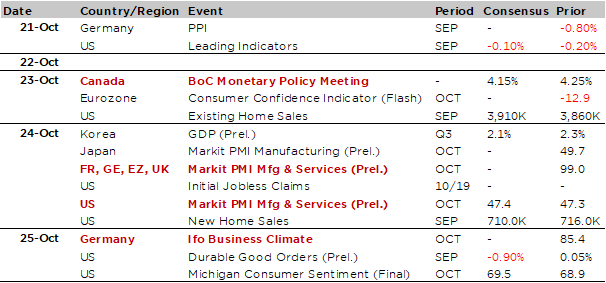
Economic calendar
A far as economic data releases and central banks meetings are concerned, it’s rather a quiet week awaiting us, with the key highlight on Thursday (October flash PMIs across the globe). They will provide an update on how the major economies have performed entering into Q4 and if the dichotomy between resilient services activity and struggling manufacturing sector persists or not (in this case, are services catching down or industrial production bottoming out?). Before that, the BoC decision is due on Wednesday. The main uncertainty here is the size of the easing: another -25bps rate cut (after already 3 consecutive ones since June) or a more aggressive -50bps easing as inflation has come down faster (1.6% September) while unemployment rate has increased further lately (to 6.5% in September vs. 5% in May).
Other notable economic releases include the German IFO business climate index (Friday), the Korea Q3 GDP (Thursday) and a few “non-core” US data such as new home sales (Thursday), jobless claims, or the durable goods orders (Friday). Otherwise, we will also get the IMF/World Bank annual meetings in Washington (21-26 October) with the release of an updated global economic outlook, while a BRICS summit will take place in Russia (22-24 October).
Finally, Q3 corporate earnings season will gather further momentum with some results from tech (featuring IBM, Texas Instrument, Lam Research or SAP), the auto sector (including Tesla, GM and Mercedes-Benz), some staples (Coca-Cola, Colgate-Palmolive, Heineken) or industrials (Honeywell and GE). In Europe, Sanofi will also be among the main highlights. Major Q3-2024 earnings releases over the week is provided at the bottom of this text.
Non-exhaustive list of major Q3-2024 earnings releases over the week (Market Cap > $100bn)

This is a marketing communication issued by DECALIA SA. It is neither directed to, nor intended for distribution or use by, any person or entity who is a citizen or resident of or located in any locality, state, country or jurisdiction where such distribution, publication, availability or use would be contrary to law or regulation. The information and data presented in this document are not to be considered as an offer or invitation to buy or sell any securities or financial instruments nor to subscribe to any services. The information, opinions, estimates, calculations etc. contained in this document reflect a judgment at the original date of publication and are subject to change without notice. Investments in any securities or financial instruments may not be suitable for all recipients and may not be available in all countries. This document has been prepared without taking account of the objectives, financial situation or needs of any particular investor. Before entering into any transaction, investors should consider the suitability of the transaction to individual circumstances and objectives. Any investment or trading or other decision should only be made by the client after a thorough reading of the relevant product term sheet, subscription agreement, information memorandum, prospectus or other offering document relating to the issue of the securities or other financial instruments. Where a document makes reference to a specific research report, the document should not be read in isolation without consulting the full research report, which may be provided upon request.
Unless specifically mentioned, charts are created by DECALIA SA based on FactSet, Bloomberg or Refinitiv data.
