What a great weekend for Italian sport! Italy won 3-1 against France in Paris in the Nations League with an amazing comeback, while Jannik Sinner became the first Italian man to win the US tennis open title. Speaking about comeback and first time, bond investors may eventually consider Japan Government Bonds (JGBs) too…
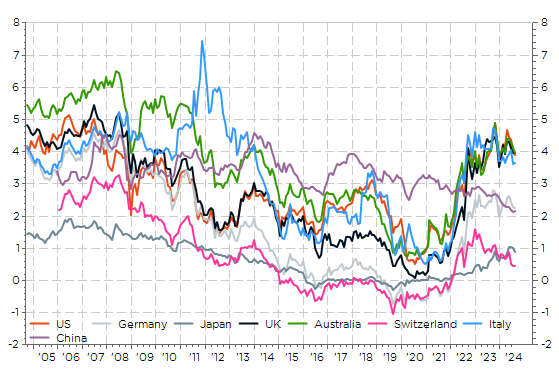
First of all, Japan long rates have also come a long way since the covid-19 but on a more gradual and thus less spectacular way than other developed markets as Japanese multidecade deflation seems finally coming to an end, while BoJ has recently ended its multiyear-long ZIRP monetary policy. As a result, the 10y JGB’s yield stands currently at 0.88%, still about 3% below 10y UST (3.74%) but twice more than Swiss 10y rate (0.43%).
Selected 10y government bond’s yield over the last 20 years

The most interesting feature of the Japanese government bonds currently is the slope of his curve, which is clearly the steepest among DM government bonds now as, except Italian BTP curve, all the other DM government bond’s yield curves are either inverted or flat.
JGB’s yield curve at different points in time

As a result, JGBs offer some roll-down “value”. For non-experts, the roll-down return is a bond trading strategy for selling a bond as it approaches its maturity date because as time passes, a bond’s yield falls, and its price rises considering a positive yield curve slope. Assuming investors face the same yield curve in 12 month time, the total return of a 10y JGBP will be +1.8% (0.9% from coupon + 0.9% from bond’s price gains as JGB 9y rate is about -11bps lower than the 10y). For other DM bonds, bond’s price gains will be nil or slightly negative.
JGBs 12M Horizon Return Analysis assuming an invariant yield curve

Last but not the least, the hedging of the currency risk -in this case the JPY- brings currently an additional significant gain as the BoJ has been much slower to hike – normalize its monetary policy -, while other central banks have just started now to ease. As of today, hedging JPY currency risks for the next 12 months brings a positive carry of +4.1%, +2.7% and +0.5% for USD, EUR and CHF investors, respectively. In particular, these forex hedging gains are a new feature for EUR or CHF investors as they incurred a small loss or insignificant gains in the decade preceding the Covid pandemics.
JPY fx hedging costs/gains for 12 months vs. other currencies

As a result, assuming investors face the same bond’s yield curves in 12 month time, JGBs are worth considering in a global bond allocation as they will have a superior fx hedged total return than domestic bonds of +5.9% in USD, +4.5% in EUR or + 2.3% in CHF… It also means that for similar yield changes/moves across the different curves, JGBs will outperform over the next 12 months.
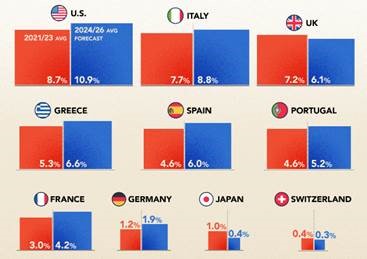
Obviously, there are several pushbacks, such as the huge (read unsustainable) amount of Japan government debt (it represents close to $10 trillion, or more than 260% of its GDP) or what will happen if BoJ reverses its QE purchases (it already halted its QE measures in March this year) as it holds 50% of outstanding JGBs in its balance sheets. Here too there are some reassuring news as (1) Japan has committed to get its fiscal house in order recently, (2) its interest expenses remain -and will remain for the next few years- contain as yields/coupons were close to nil for the last 2 decades (average coupon is currently around 1% with an average maturity in excess of 13 years), (3) with inflation normalizing closer to 2% – i.e. above the costs of accumulated debt – it may feel less burdensome and (4) Japan government debt is structurally less at risk of a crisis as it could be funded by domestic savings with an average current account surplus in between 3-4% of GDP over the last decade. In this regard, Japan’s MUFG said last week it would consider shifting more of its massive securities portfolio into JGBs if/when 10-year yields reach 1.2%. In other words, this kind of behavior should act as a backstop and thus impede a proper debt crisis.
Net interest expenses as % of government revenues (source: visualcapitalist.com)

As a result, we have added a 3% allocation in JGBs in our global bond fund during this summer, split on 2 positions (a 20y JGB and a JGBs All Maturities ETF).
A first time is good for everything!

Economic Calendar
Investors will have many key highlights to process this week, starting with the first presidential debate between Harris and Trump on Tuesday evening, August US inflation report on Wednesday and the ECB monetary policy meeting on Thursday. From China, we will get the August CPI today and the latest economic activity (industrial production, retail sales and fixed investment) on Saturday morning.
This morning, China’s headline CPI came below consensus, ticking up to +0.6% year-over-year in August from +0.5% in July, while the consensus was expecting +0.7%. Moreover, most of this modest increase can be attributed to surging vegetable prices due to bad weather conditions, while energy prices plunged (-2.9% MoM) and core inflation also fell from 0.4% YoY to 0.3%, reaching its lowest point since 2021, another sign of weak domestic demand (failing to keep pace with the supply-side expansion of the economy).
Turning to the US, I won’t comment the much awaited first debate between Kamala Harris and Donald Trump for the US presidential election as you can refer to my last week note (here) for those interested in my views about the incoming presidential elections. In the meantime, the jury is still out among both investors and Fed officials about the size of the first Fed’s rate cut on September 18th after last Friday US job report. It increased investor desire to see a 50bp rate cut in September without equally increasing investor confidence that the Fed would deliver it… hurting risk-sentiment.
While Fed members broadly/unanimously support monetary easing now, they likely disagree on why and therefore the extent/size of rate cuts. It’s a conceptual debate reflecting broader concerns over balancing inflation control and economic growth, with officials -like investors- split on long-term risks, recession potential, and inflation trends. Basically, it could be summed up like this: should the Fed do its best to prevent further labor market slowing (front-loading easing with one or two 50bps cuts and then slowdown) or should it react more gradually first and then eventually heal after further slowing (start with 25bps cut and then adjust if necessary)? In this context, the August US CPI report, which will be released on Wednesday, may help to tip the balance in favor of more or less patience. However, it may prove inconclusive as well as the US headline inflation is expected to slow to 2.6% in August from 2.9% in July (+0.2% MoM expected), while the core inflation should remain stable at 3.2% (+0.2% MoM) on the back of stickier super core services inflation.
Finally, moving to Europe, the ECB is widely expected to deliver a second -25bps rate cut to 3.5% to the deposit facility rate on Thursday. However, ECB policymakers seem also divided on the pace and timing of monetary easing thereafter. While there’s consensus on the need for easing here again, some hawks urge caution due to persistent wage pressures and services inflation, advocating for a gradual, data-dependent approach. Doves stress the need to avoid overly restrictive policies that could hinder growth. As a result, the focus will be on how strongly the ECB president pushes back on market expectations of a 50% chance of another cut in October. In this regard, the updated macroeconomic forecasts on both growth and inflation will be worth watching.
Note that our views on monetary policy in our global macro scenario haven’t changed: the Fed will ease gradually (-25bps in September) amid resilient growth, while ECB will maintain quarterly pace of -25bps rate cuts (lowering its growth outlook but likely not foreseeing a return of inflation to its 2% target before 2026).

This is a marketing communication issued by DECALIA SA. It is neither directed to, nor intended for distribution or use by, any person or entity who is a citizen or resident of or located in any locality, state, country or jurisdiction where such distribution, publication, availability or use would be contrary to law or regulation. The information and data presented in this document are not to be considered as an offer or invitation to buy or sell any securities or financial instruments nor to subscribe to any services. The information, opinions, estimates, calculations etc. contained in this document reflect a judgment at the original date of publication and are subject to change without notice. Investments in any securities or financial instruments may not be suitable for all recipients and may not be available in all countries. This document has been prepared without taking account of the objectives, financial situation or needs of any particular investor. Before entering into any transaction, investors should consider the suitability of the transaction to individual circumstances and objectives. Any investment or trading or other decision should only be made by the client after a thorough reading of the relevant product term sheet, subscription agreement, information memorandum, prospectus or other offering document relating to the issue of the securities or other financial instruments. Where a document makes reference to a specific research report, the document should not be read in isolation without consulting the full research report, which may be provided upon request.
Unless specifically mentioned, charts are created by DECALIA SA based on FactSet, Bloomberg or Refinitiv data.
